ThingsBoard, Grafana & ChirpStack in the Modern IoT Stack: Roles, Integration and Use Cases


Looking for a Self-Hosted IoT Stack? We support you with planning, installation and operation of ThingsBoard, Grafana and ChirpStack – GDPR-compliant on your own infrastructure. ThingsBoard Managed Hosting · ChirpStack Managed Hosting · Grafana Managed Hosting · Professional IoT Hosting with merkaio
IoT projects face a central challenge: Which components are needed for a functional IoT stack? From the sensor layer to data collection and visualization, various systems must work together seamlessly. Many teams rely on a combination of specialized tools rather than monolithic platforms that try to cover everything.
ThingsBoard, Grafana and ChirpStack are three open-source tools that complement each other ideally, each focusing on its core competency. ChirpStack handles LoRaWAN connectivity, ThingsBoard manages devices and processes data, Grafana provides deep data analysis.
Table of Contents
- The 5 Layers of the IoT Stack
- ChirpStack: LoRaWAN Network Server
- ThingsBoard: IoT Platform
- Grafana: Visualization & Analysis
- Comparison Table
- Integration: How They Work Together
- Use Case: Smart City
- Related Guides
The 5 Layers of the IoT Stack
A modern IoT stack can be divided into five layers, each taking on specific tasks:
-
Sensors & Actuators (Device Layer): Physical sensors capture data (temperature, vibration, GPS), actuators control devices (valves, motors).
-
Connectivity (Network Layer): Transmission of sensor data via LoRaWAN (ChirpStack), MQTT, HTTP or other protocols to the backend.
-
Data Aggregation & Processing (Middleware): ThingsBoard collects, processes and stores data. The Rule Engine enables real-time processing and alarms.
-
Visualization & Analysis (Presentation Layer): ThingsBoard offers operational real-time dashboards with device interaction. Grafana enables analytical dashboards for long-term trends and KPIs.
-
Device Management (Management Layer): ThingsBoard handles provisioning, firmware updates, monitoring and security.
ChirpStack: LoRaWAN Network Server
ChirpStack is an open-source LoRaWAN Network Server for the connectivity layer. LoRaWAN enables long-range (up to 15 km), energy-efficient communication – ideal for battery-powered sensors with lifespans of 5-10 years.
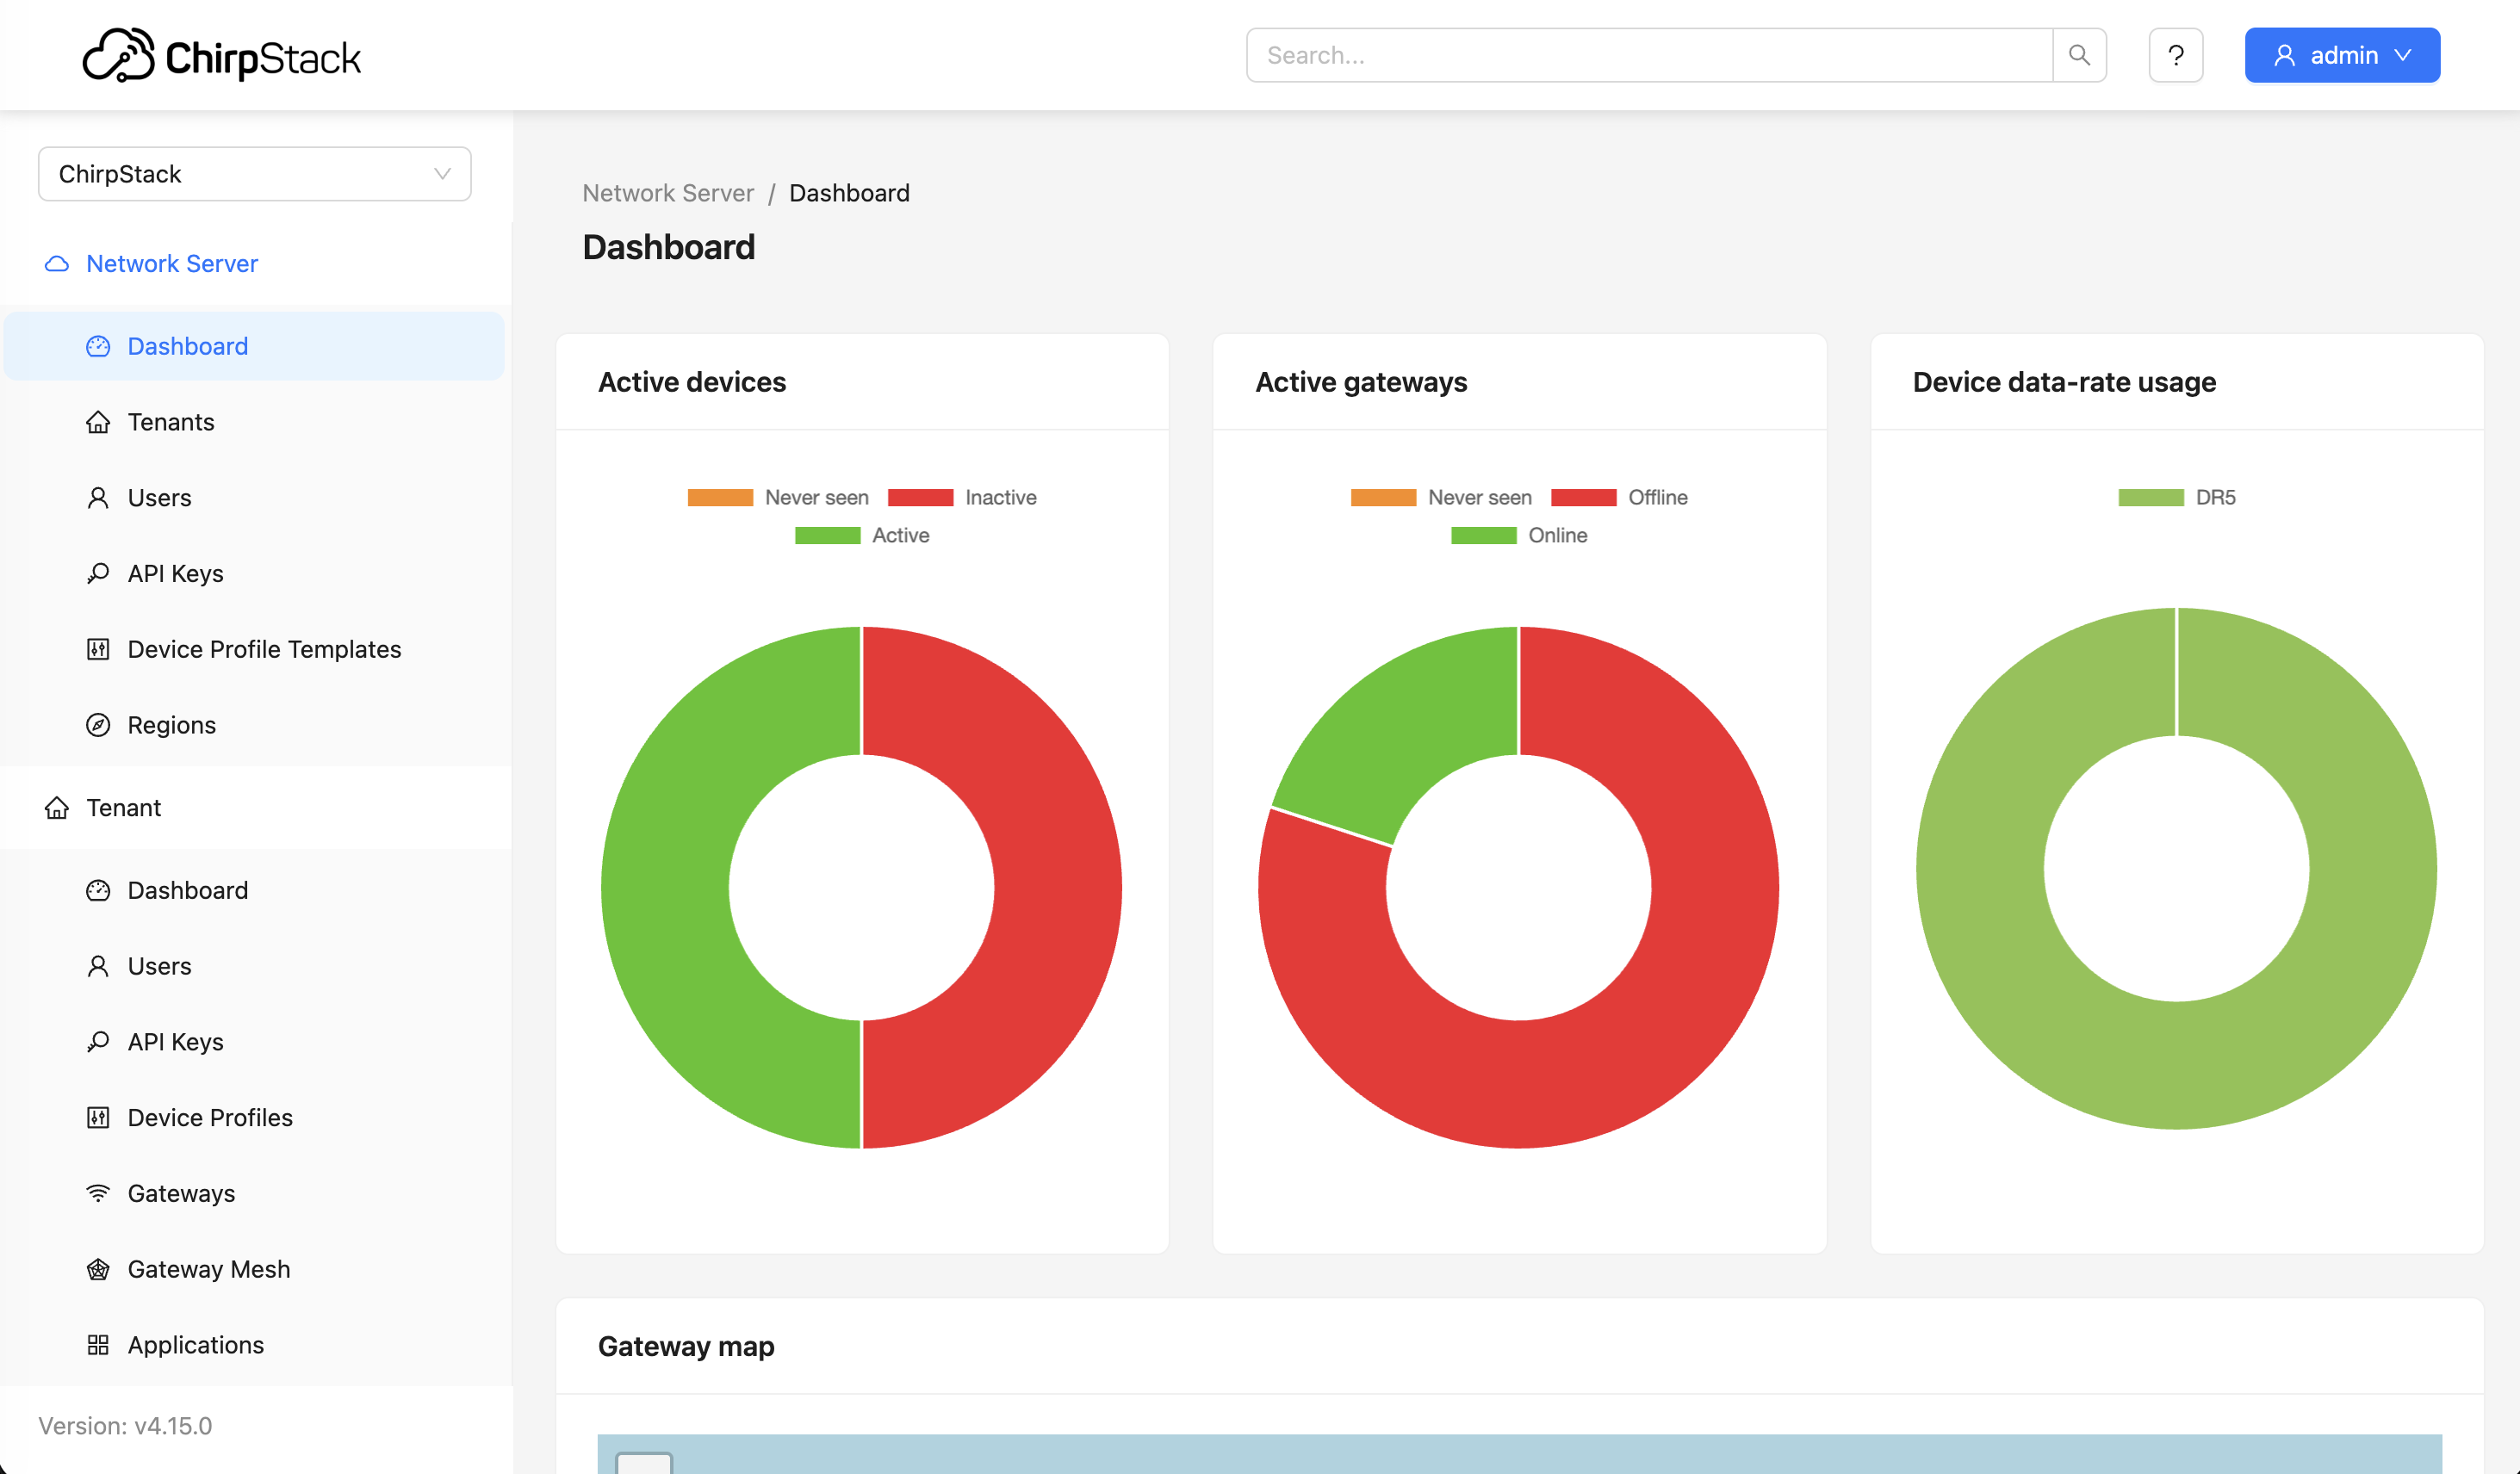 ChirpStack web interface: Managing LoRaWAN gateways, devices and applications
Core Functions:
- Gateway and device management for LoRaWAN (Class A, B, C)
- Over-the-Air Activation (OTAA) and downlink scheduling for device control
- MQTT/HTTP integration for data forwarding to ThingsBoard
- Microservices architecture (Gateway Bridge, Network Server, Application Server) for horizontal scaling
ChirpStack is the ideal choice for LoRaWAN-based IoT projects. More on our ChirpStack expertise page or directly to ChirpStack Managed Hosting by merkaio.
ThingsBoard: IoT Platform
ThingsBoard is an open-source IoT platform for data collection, processing, visualization and device management. Unlike ChirpStack, ThingsBoard is protocol-agnostic and supports MQTT, HTTP, CoAP as well as LoRaWAN integrations.
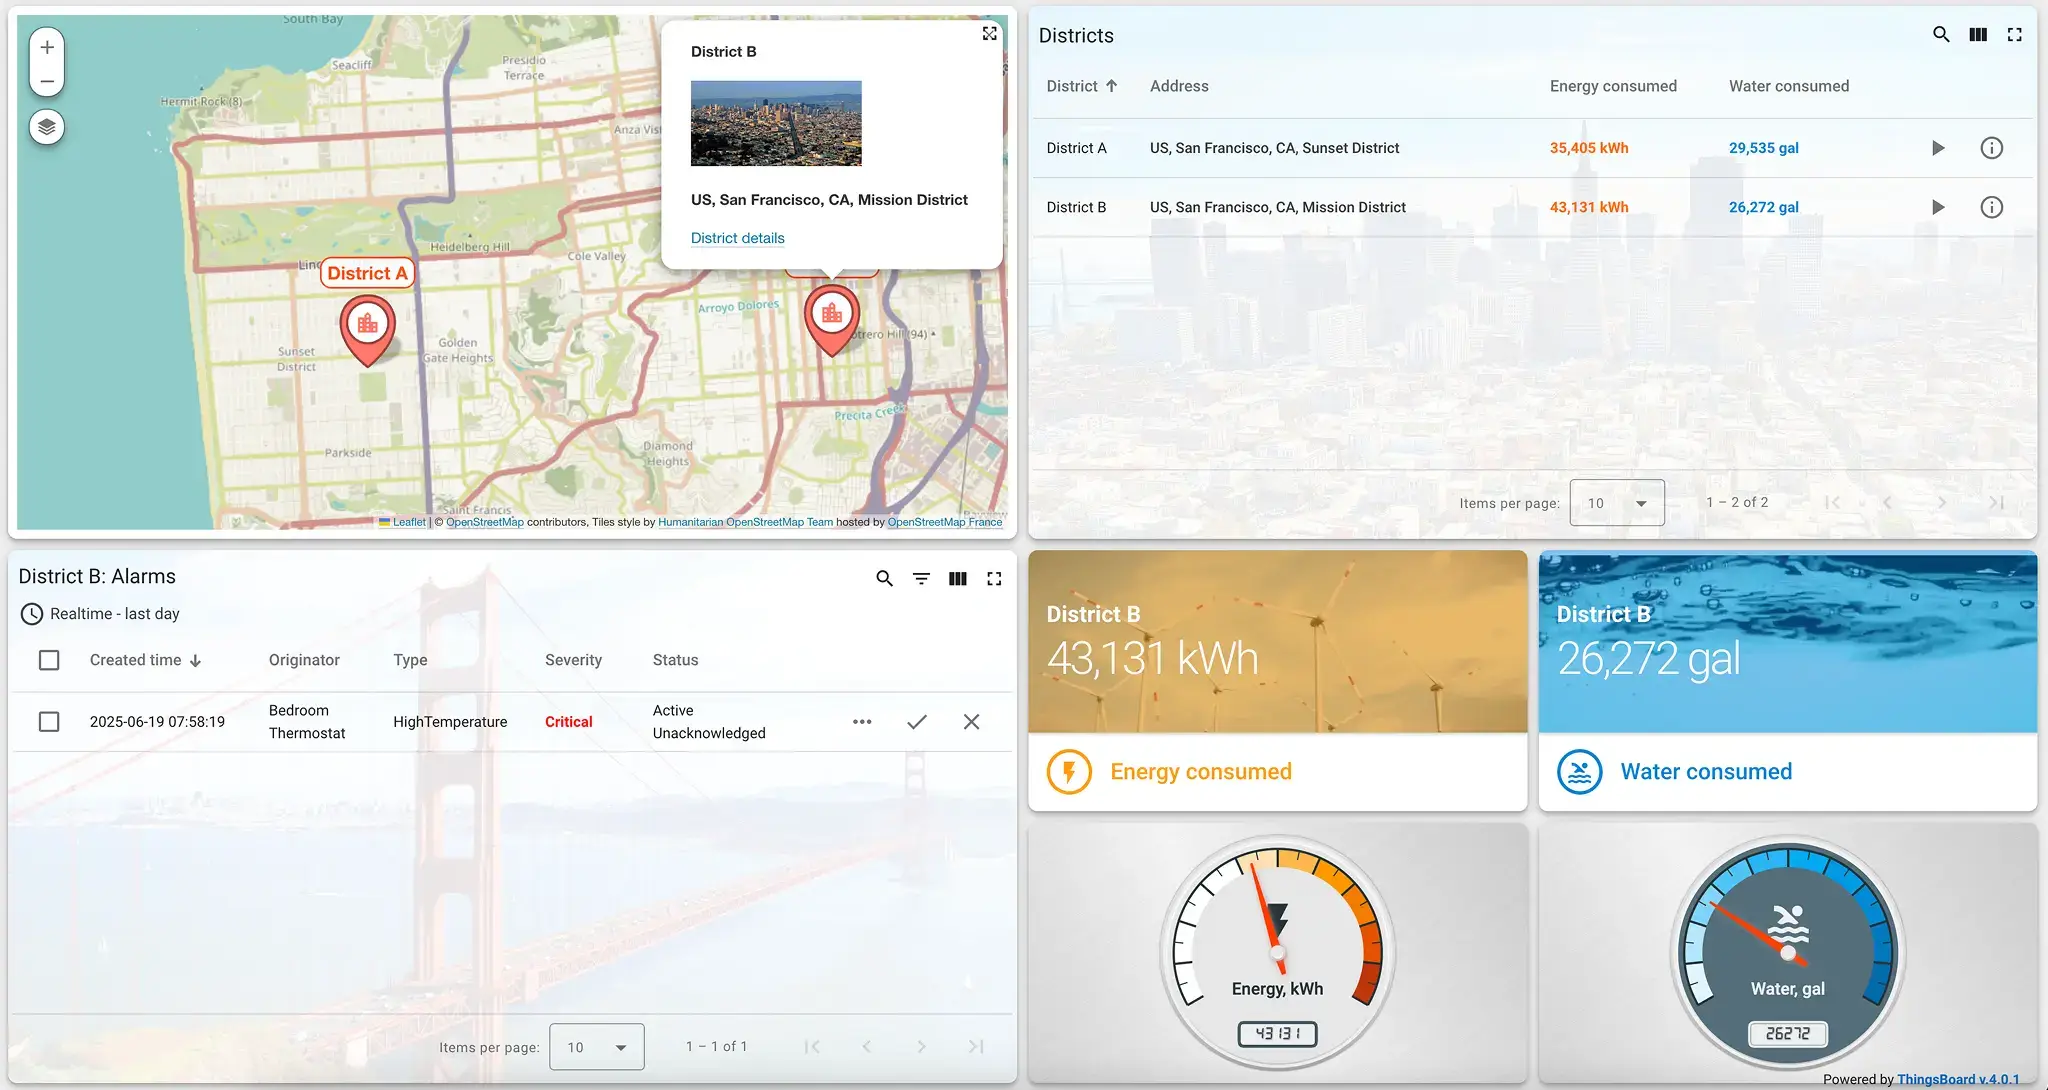 ThingsBoard dashboard with real-time widgets, maps and device controls
Core Functions:
- Device management for millions of devices with hierarchical organization
- Rule Engine for real-time data processing, alarms and notifications (email, SMS, webhooks)
- 600+ IoT widgets for real-time dashboards with device interaction (switches, sliders, maps)
- Multi-tenancy with tenant hierarchy and role management
- Support for PostgreSQL, Cassandra and TimescaleDB
ThingsBoard is ideal as a central IoT platform for various protocols. More on our ThingsBoard expertise pages or directly to ThingsBoard Managed Hosting by merkaio.
Grafana: Visualization & Analysis
Grafana is an open-source platform for data visualization and monitoring. While ThingsBoard is designed for operational real-time dashboards with device control, Grafana is suited for analytical dashboards with long-term metrics and KPI reporting.
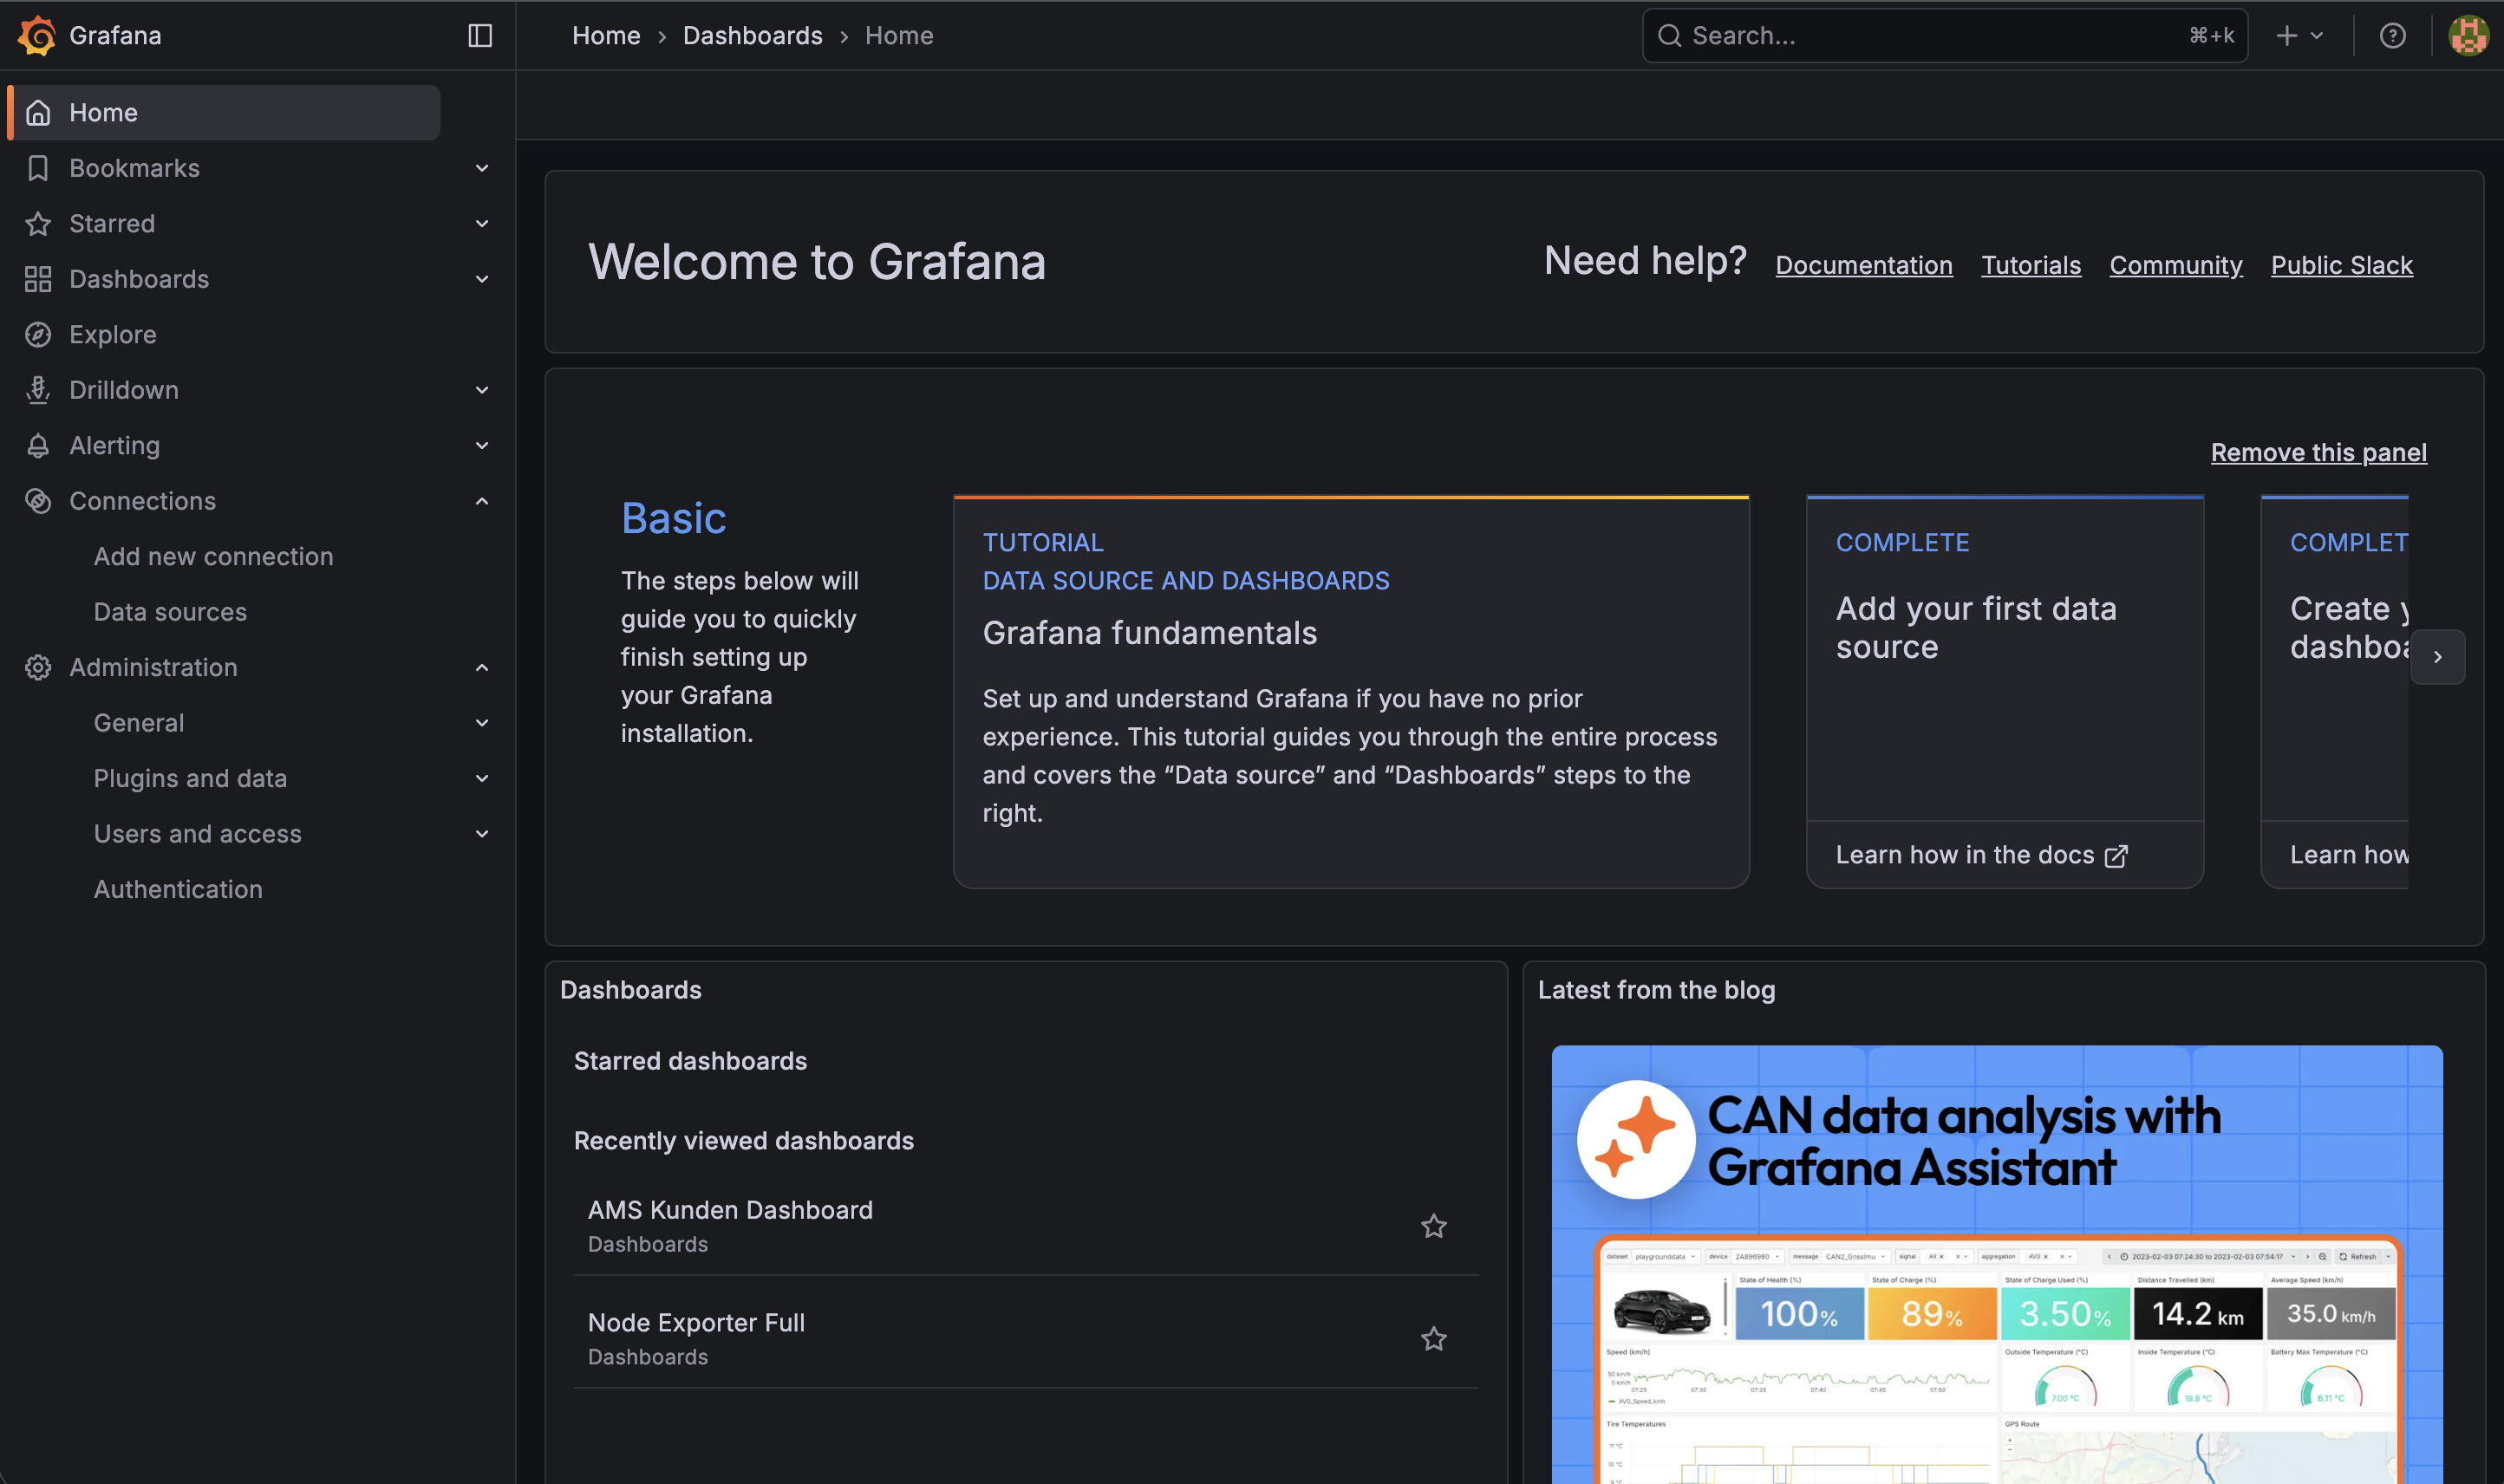 Grafana dashboard: Time-series visualization and data analysis with multiple panels
Grafana accesses ThingsBoard data via PostgreSQL/TimescaleDB or REST API and offers extensive visualization and drill-down capabilities. Ideal for management reporting, long-term trends and multi-source dashboards (e.g., IoT + IT metrics). More on our Grafana expertise page or directly to Grafana Managed Hosting by merkaio.
Comparison Table
Here's a compact overview of the three tools in direct comparison:
| Feature | ChirpStack | ThingsBoard | Grafana |
|---|---|---|---|
| Primary Role | LoRaWAN Network Server | IoT Platform | Visualization |
| IoT Stack Layer | Connectivity (Layer 2) | Middleware (Layer 3) + Device Mgmt. (Layer 5) | Visualization (Layer 4) |
| Protocols | LoRaWAN | MQTT, HTTP, CoAP, LoRaWAN, OPC-UA, Modbus | - (reads from data sources) |
| Device Management | LoRaWAN devices, gateways | All IoT devices (protocol-agnostic) | - |
| Dashboards | Basic UI for gateways/devices | 600+ IoT widgets, real-time, interactive | Extensive visualizations, analytical |
| Rule Engine | - | ✓ (Visual rule chain, JavaScript) | - |
| Alerting | - | ✓ (Email, SMS, webhooks) | ✓ (Email, Slack, PagerDuty) |
| Database | PostgreSQL (metadata), Redis (real-time) | PostgreSQL, Cassandra, TimescaleDB | All common (PostgreSQL, InfluxDB, Prometheus, etc.) |
| Multi-Tenancy | Limited (organizations) | ✓ (Tenants, customers, hierarchy) | ✓ (Organizations) |
| License | Apache 2.0 | Apache 2.0 (CE) + Proprietary (PE/EE) | AGPL v3 (OSS) + Proprietary (Enterprise) |
| Strengths | LoRaWAN specialist, energy-efficient | Comprehensive IoT platform, rule engine | Deep data analysis, multi-source dashboards |
| Weaknesses | LoRaWAN only | More complex setup, resource-intensive | No device interaction, no rule engine |
Conclusion: The three tools complement each other ideally – ChirpStack for LoRaWAN connectivity, ThingsBoard as central IoT platform, Grafana for analytical dashboards.
Integration: How They Work Together
The three tools integrate seamlessly: ChirpStack sends data via MQTT to ThingsBoard. ThingsBoard processes the data with the Rule Engine and stores it in PostgreSQL/TimescaleDB. Grafana accesses the data via SQL query or REST API.
LoRaWAN Sensor → ChirpStack → MQTT → ThingsBoard → PostgreSQL → Grafana
This architecture enables LoRaWAN connectivity, real-time processing with Rule Engine, operational dashboards in ThingsBoard and analytical dashboards in Grafana for management reporting. For additional automation, you can integrate Node-RED – also available as Managed Hosting.
Use Case: Smart City
Challenge: A city wants to monitor parking spaces in real-time and show availability to citizens via an app. At the same time, occupancy should be analyzed to optimize parking space planning.
Setup:
- Sensors: Parking sensors with LoRaWAN (battery-powered, 5-10 years lifespan)
- ChirpStack: Management of LoRaWAN gateways (e.g., mounted on lampposts), receiving occupancy data
- ThingsBoard: Real-time map with parking space status (green = free, red = occupied), alarms for sensor failure, REST API for mobile app, data storage in PostgreSQL/TimescaleDB
- Grafana: Occupancy heatmaps by day of week and time, KPI dashboard for city planning, long-term trends
Benefits: Real-time parking display for citizens, less parking search traffic, data-driven city planning, reduced CO₂ emissions.
More Smart City IoT solutions by merkaio for parking management, waste management and environmental monitoring.
Related Guides
- ThingsBoard Managed Hosting
- ThingsBoard Installation Guide
- ChirpStack Managed Hosting
- Grafana Managed Hosting
- Node-RED Integration
- merkaio IoT Managed Hosting Services
- Smart City IoT Solutions
- Smart Agriculture & LoRaWAN
Conclusion
ThingsBoard, Grafana and ChirpStack form a powerful combination for IoT projects: ChirpStack for LoRaWAN connectivity, ThingsBoard as central platform for device management and data processing, Grafana for analytical dashboards. All three are Open Source and can be self-hosted GDPR-compliant.
Would you like to build your own IoT stack? Request free consultation
Frequently Asked Questions
Answers to important questions about this topic
ChirpStack is a LoRaWAN Network Server for the connectivity layer, managing LoRaWAN gateways and devices. ThingsBoard is an IoT platform for device management, data collection and rule engine. Grafana is primarily a visualization tool for dashboards and monitoring. All three complement each other in the IoT stack.
Yes, ThingsBoard supports many protocols (MQTT, HTTP, CoAP) and can communicate directly with sensors. ChirpStack is only needed if you want to use LoRaWAN devices.
ThingsBoard offers 600+ IoT-specific widgets and is ideal for real-time dashboards with device interaction. Grafana is better for deep data analysis, long-term metrics, and when you already use other monitoring systems (Prometheus, InfluxDB).
ChirpStack sends data via MQTT or HTTP/REST to ThingsBoard. ThingsBoard stores data in PostgreSQL/Cassandra/TimescaleDB. Grafana can use these databases as data sources or access data via ThingsBoard's REST API.
Yes, all three are Open Source. ChirpStack is Apache 2.0 licensed, ThingsBoard has a Community Edition (Apache 2.0) and Enterprise Edition, Grafana is AGPL v3 licensed (with Enterprise options).
For smaller installations, PostgreSQL is sufficient (supported by ChirpStack and ThingsBoard). For large data volumes, TimescaleDB (PostgreSQL extension for time series) or Cassandra for massive scaling is recommended.
Written by
Timo Wevelsiep
Co-Founder & CEO
Co-Founder of WZ-IT. Specialized in cloud infrastructure, open-source platforms and managed services for SMEs and enterprise clients worldwide.
LinkedInLet's Talk About Your Idea
Whether a specific IT challenge or just an idea – we look forward to the exchange. In a brief conversation, we'll evaluate together if and how your project fits with WZ-IT.
Trusted by leading companies


Timo Wevelsiep & Robin Zins
CEOs of WZ-IT