






Architecture and migration
Sizing, target environment, data transfer, cutover and recovery are resolved before production operations.
WZ-IT plans, installs, integrates and operates Grafana in the agreed target environment. Depending on the target design, we also provide migration, secure network and identity integration, monitoring, backups, updates, integrations and further development.
The following are trademarks of their respective owners: Grafana (Raintank, Inc. d/b/a Grafana Labs). WZ-IT is an independent service provider and has no business, partnership, or contractual relationship with these companies. We offer independent migration, installation, hosting, and operations services.
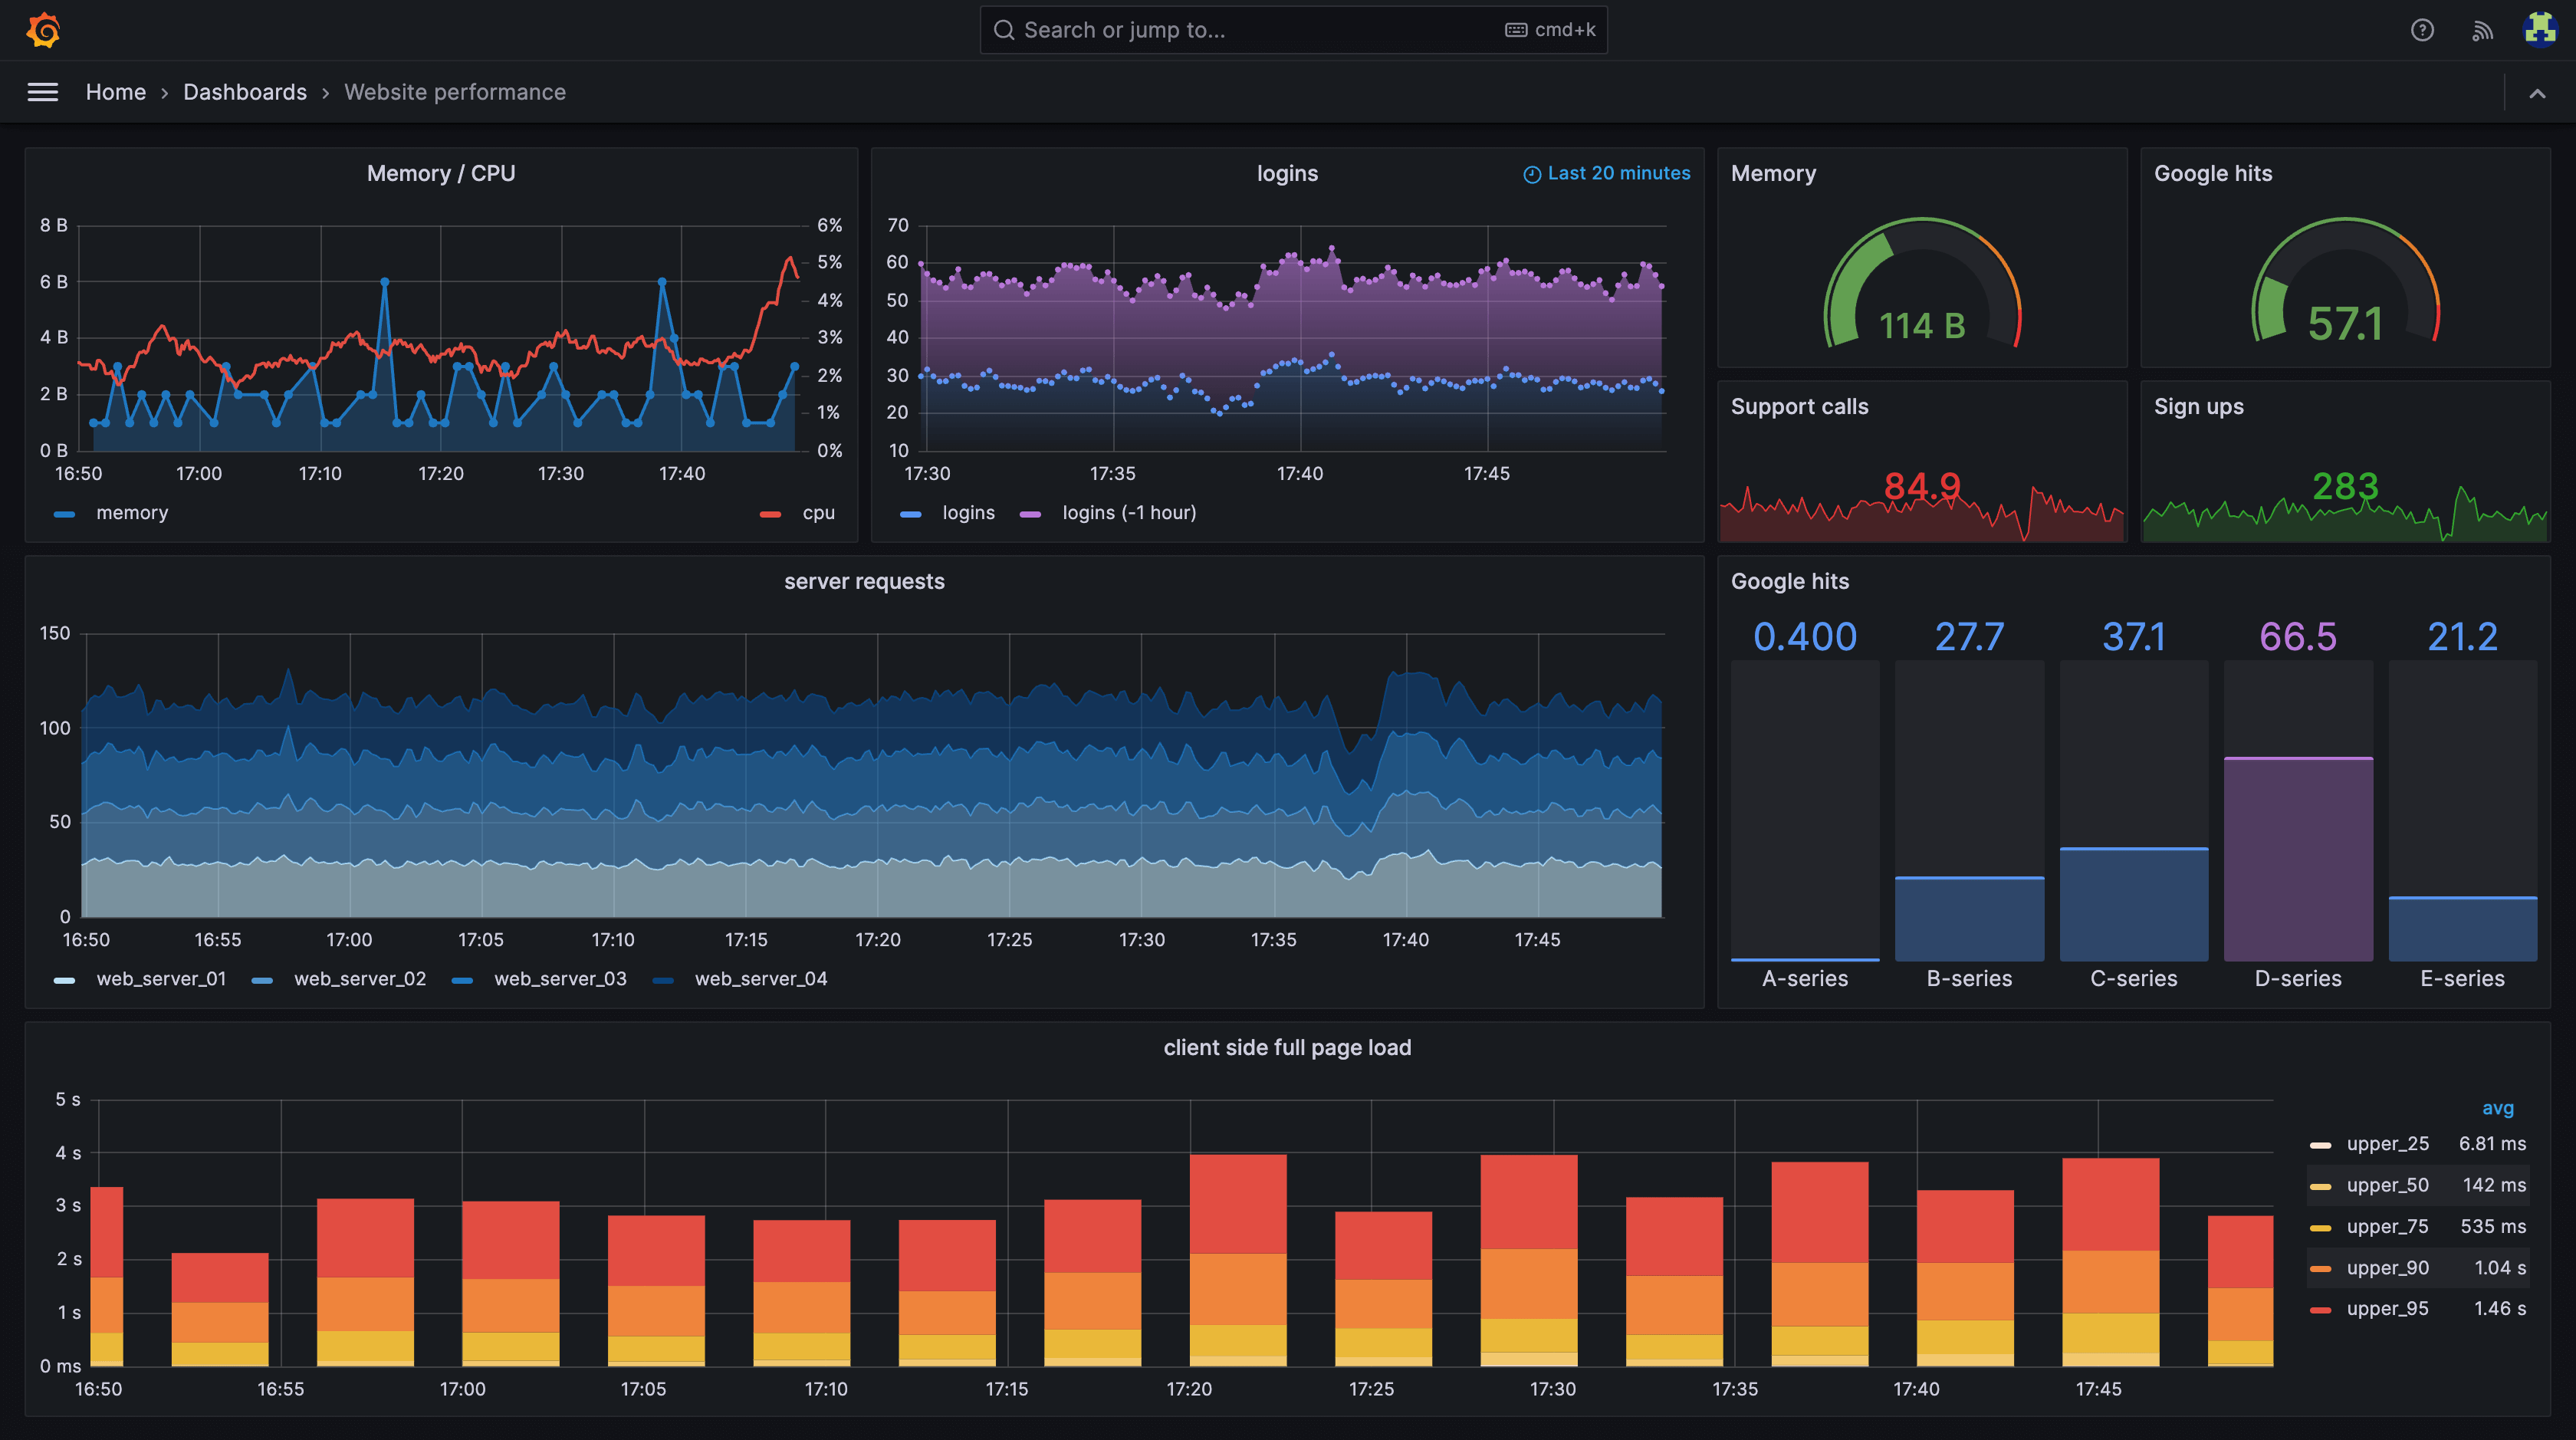
Grafana is a widely used open-source platform for monitoring and observability. It visualises metrics, logs and other data from connected sources in shared dashboards.
From Kubernetes clusters and application performance to business metrics, we connect suitable data sources and design dashboards, operations, permissions, alerting and retention for your observability architecture.
We install, host and operate Grafana for your company - either on our secure, privacy-focused infrastructure in Germany or other locations, as well as on-premise in your own environment.
We provide 24/7 monitoring, backups and maintenance for your Grafana instance. Human response times and support coverage follow the selected service level.
Unify your data from different sources in one dashboard. Prometheus, Elasticsearch, InfluxDB, MySQL and over 100 other data sources are natively supported.
Create, manage and group alerts from all data sources. With Grafana Alerting, define complex rules and route notifications to different channels.
From time series to heatmaps to geo-maps - Grafana offers over 30 different visualization types and enables the creation of meaningful dashboards.
Integrated solution for Logs (Loki), Graphics (Grafana), Traces (Tempo) and Metrics (Mimir/Prometheus) - everything from a single source for complete observability.
Share dashboards with your team, annotate graphs for better context and use the integrated user management with LDAP/OAuth integration.
With the appropriate vendor licence, Grafana Enterprise adds capabilities including advanced RBAC, SAML and audit logging. Required features are planned by edition.
Professional installation on your infrastructure - on-premise, cloud or hybrid
In your data center
AWS, Azure, Hetzner & more
Advanced architecture after technical and licence assessment
Central visualization of metrics, logs and traces from all data sources
KPI dashboards and business metrics from databases and analytics platforms
Real-time visualization of IoT sensors and industrial automation
APM dashboards with Prometheus, InfluxDB, Elasticsearch integration
Server, Kubernetes, cloud infrastructure with alerting and incident management
SQL-based dashboards with PostgreSQL, MySQL, BigQuery, Snowflake
Secure access and access control for your installation
WireGuard, NetBird or Tailscale
Directly or through an upstream identity layer
Depends on application, edition and identity provider
Fail2Ban, Rate Limiting, IP Whitelisting
We set up secure VPN access to your installation - ideal for remote work and external employees.
Full-service installation with no hidden costs
Grafana is more than just dashboards. It's a platform for observability apps. We develop native plugins that transform Grafana into a control center for your specific data sources.
Standard data sources like Prometheus are often insufficient. We develop custom data source plugins in Go that directly connect proprietary APIs, legacy SQL databases, or IoT gateways - including query editor and alerting support.
For special visualizations (e.g., machine layouts, wind turbine status), we develop custom panels in React. These use the Grafana Data Frame format and are fully interactive.
We bundle data sources, panels, and dashboards into complete 'Grafana Apps'. Ideal for delivering ready-made monitoring solutions to your end customers without them having to configure anything.
How we implement Grafana development in practice.
Your industrial devices deliver data via a special REST or SOAP API that Grafana doesn't natively support. External exporters are unstable.
A backend plugin in Go that communicates directly with the API, implements caching, and converts data into Grafana-compatible frames. Performant and maintainable.
Standard graphs cannot intuitively represent the physical state of a plant. Operators need a visual site plan.
A custom panel plugin that renders SVG graphics of your plant and visualizes live values (temperature, RPM) directly on the components with color coding.
Dashboard screenshots are insufficient for audits. Generated PDFs with specific layouts and comments are required.
We use the rendering API to generate automated reports, enrich them with metadata, and send them via email or store them in the DMS.
We do more than provide an application. WZ-IT designs the technical architecture, integrates network and identity, operates the agreed scope and develops integrations when the standard product is not enough.
Sizing, target environment, data transfer, cutover and recovery are resolved before production operations.
SSO, secure access, internal systems and existing security components are integrated appropriately.
Updates, backups, technical monitoring and response paths follow a transparent operational scope.
APIs, automation and custom extensions can be delivered beyond basic deployment.
The exact scope depends on the application, edition, infrastructure and criticality. Vendor licences and non-standard components are quoted separately.
Monitoring and analytics need reliable data sources, an appropriate storage strategy and alert paths that connect to real operating processes.
Metrics, logs, availability checks or usage events are collected in a controlled way.
TLS, firewall rules, reverse proxies or private network paths are designed around the platform's exposure.
Local accounts, SSO, directories, service accounts and emergency access are connected through clear roles.
Queries, dashboards, rules, tenants and retention are operated according to the observation objective.
Agents, exporters, APIs and secure connections to monitored systems.
Storage, retention, aggregation and capacity planning according to data volume.
Deduplication, escalation and handoff to agreed operational and support paths.
The diagram is a resilient target model. Its implementation depends on edition, data flows, load, availability objectives and existing infrastructure.
A clearly defined operating scope instead of an opaque hosting flat fee.
We combine the right compute size with ongoing operations, backups, monitoring and a service level appropriate for the criticality of Grafana. High availability and recovery targets are designed separately where needed.
We also design custom hosting architectures, integrations and migrations around Grafana. Contact us for a technical assessment.
One managed standard Grafana application is included in the Starter workload. Every service level also includes flexible expert time for planned work during regular service hours. Select compute, additional applications, storage and the appropriate service level.
A workload is one compute instance with the applications agreed for it.
One standard app per workload is already included. Additional dedicated servers count as separate workloads.
€79.90 per started TB and month, including daily encrypted offsite backup with 7-day retention.
Briefly describe the current state and objective for Grafana. We assess infrastructure, integration, and ongoing operations.
Whether you run Grafana in-house or need to host confidentiality-professional data §203-ready - we build, operate and maintain Grafana on an encrypted on-site server. Data never leaves the building in cleartext.
See Grafana on-premise
19.02.2026
Dortmund is one of Germany's most important logistics hubs. The Port of Dortmund as Europe's largest canal port, the former Westfalenhuette site as a logistics...
03.02.2026
IoT projects face a central challenge: Which components are needed for a functional IoT stack? From the sensor layer to data collection and visualization, various...
These solutions are often used together with Grafana
These solutions offer similar functionalities and can be evaluated together
No risk: worst case, you leave with a clearer understanding of your project than before.


“WZ-IT's advice on our Azure migration was technically sound and completely non-binding right from the intro call - we took away a great deal.”
Whether a specific IT challenge or just an idea - we look forward to the exchange. In a brief conversation, we'll evaluate together if and how your project fits with WZ-IT.
Timo Wevelsiep & Robin Zins
Managing Directors of WZ-IT