WZ-IT Logo

Grafana Dashboards & IoT Monitoring.

Custom dashboards, embedded panels, alerting and self-hosting. We build Grafana-based monitoring platforms for IoT, ops teams and data analysis – GDPR-compliant on German infrastructure.

Trusted by leading companies

  • Rekorder
  • Keymate
  • Führerscheinmacher
  • SolidProof
  • ARGE
  • Boese VA
  • NextGym
  • Maho Management
  • Golem.de
  • Millenium
  • Paritel
  • Yonju
  • EVADXB
  • Mr. Clipart
  • Aphy
  • Negosh
  • ABCO Water
Grafana IoT Monitoring Dashboard
Grafana

What Is Grafana?

Grafana is the leading open-source platform for monitoring and data visualization. Over 20 million active instances worldwide, the industry standard for ops teams. Connects to any data source: InfluxDB, TimescaleDB, PostgreSQL, Prometheus, MQTT.

Grafana is, alongside ThingsBoard, one of the core foundations on which we build IoT platforms. Grafana is our tool for technical monitoring dashboards and ops teams. ThingsBoard is used for end-customer dashboards and device management. Both complement each other.

Grafana
Open Source
Alerting
Multi-Tenant
GDPR-compliant

Want to build a project with Grafana?

Custom dashboards, embedded panels, alerting or self-hosting – we develop and operate Grafana platforms for your use case.

Features

What We Do with Grafana

Custom Dashboards

Panels, layouts, template variables for dynamic views. Sensor time series, device status, KPIs – visualized for ops teams and management.

IoT Alerting

Threshold alerts, anomaly detection, escalation logic. Notifications via email, Slack, PagerDuty, Teams – reliable, without polling.

Embedded Panels

Embed Grafana panels into your own web portals, customer dashboards or React applications. Iframe and API-based, with token auth.

Data Source Integration

InfluxDB and TimescaleDB for IoT time-series data, PostgreSQL for master data, Prometheus for system metrics – all in one dashboard.

Multi-Tenant Views

Organizations and teams, role-based access control. Each team sees only its own data, its own dashboards, its own alerting rules.

SCADA-Like Dashboards

Process visualization, equipment status, flowcharts for industrial environments. Canvas plugin for custom layout design.

You got questions? We are here to help!

Data Sources

Grafana + Data Sources

The right database for your use case

InfluxDB

High-frequency sensor data, optimized for time series. Fast range queries across millions of data points.

TimescaleDB

SQL-compatible, ideal when sensor data needs to be combined with master data (JOINs).

PostgreSQL

Device configuration, tenant data, master data – query directly from the ThingsBoard database.

Prometheus

System metrics of the IoT infrastructure: CPU, memory, MQTT broker stats, Node.js metrics.

We choose the data source based on your use case – not personal preference.

Hosting & Operations

Running Grafana on dedicated infrastructure

We deploy and operate Grafana on dedicated servers in German data centers. Docker-based, CI/CD-ready. No Grafana Cloud vendor lock-in – full control over data and configuration.

Migration from Grafana Cloud to self-hosted including dashboard export, data source configuration and alerting transfer.

Docker Deployment

Reproducible container-based deployments, CI/CD pipeline, infrastructure-as-code

Hetzner / Germany

Dedicated servers in German data centers, full GDPR compliance

Monitoring the Monitor

Prometheus and Alertmanager monitor the Grafana instance itself – outages are detected immediately

Backups & Updates

Automated backups, regular updates, security patches in ongoing operations

Cloud Migration

Migration from Grafana Cloud to self-hosted: dashboards, data sources, alerting rules

Managed Operations

Updates, capacity planning and incident response in ongoing operations

Grafana

OSS vs Enterprise

For most IoT projects, Grafana OSS is sufficient.

Grafana OSS

Free and open source. 50+ data sources, dashboards, alerting, teams and organizations. Limited SAML/LDAP. Fully sufficient for most IoT projects.

Grafana Enterprise

Licensed. Additional enterprise data sources, full SAML/LDAP, audit logs and advanced access control. For compliance requirements in regulated environments.

Stack

Grafana in the Overall Stack

Not isolated, but as the monitoring layer in the IoT stack

ThingsBoard

ThingsBoard

End-customer dashboards and device management. 600+ widgets, multi-tenant, rule engine – complements Grafana as the platform core.

InfluxDB

Time-series database for high-frequency sensor data. Primary data source for Grafana IoT dashboards.

Prometheus

Prometheus

Metrics of the IoT infrastructure: MQTT broker, Node.js, databases – natively integrated into Grafana.

Node.js

Node.js

Custom backend for MQTT ingestion, WebSocket streams and data processing between sensors and Grafana.

Node-RED

Node-RED

Flow-based integration for data pipelines, protocol conversion and ERP connectivity.

React Native

Mobile apps with embedded Grafana panels: sensor dashboards, push alerting, offline sync.

Who Is This For?

Grafana services for different starting points

Ops Teams

You have sensor data in InfluxDB or Prometheus and need structured dashboards and reliable alerting. We build the dashboards, you operate them.

Existing Grafana Instances

You already use Grafana and want custom dashboards, embedded panels or multi-tenant views. We extend your existing installation.

IoT Platform Operators

You run ThingsBoard or a custom platform and need Grafana as a monitoring layer for ops teams and technical analysis.

Agencies & System Integrators

You deliver IoT projects to your customers and need Grafana expertise for dashboards, alerting and embedded panels.

merkaio

merkaio – IoT System Integrator for the Entire Lifecycle

Grafana development is merkaio. Analysis, architecture, development, operations – all under one brand. From the first dashboard concept to ongoing managed operations.

Discover merkaio

What Do You Need?

1/2 – Interest50%

Frequently Asked Questions

Frequently asked questions about Grafana dashboards and IoT monitoring

Grafana for technical monitoring dashboards, ops alerting and data analysis. ThingsBoard for end-customer dashboards, device management and multi-tenant. In our IoT projects, both run in parallel with a clear separation of responsibilities.

Yes. Via embedded panels (iframe with auth token) or the Grafana HTTP API, dashboards and individual panels can be integrated into React applications, customer portals or mobile apps. We configure token auth and CORS settings.

Over 50 data sources out-of-the-box: InfluxDB, TimescaleDB, PostgreSQL, Prometheus, MySQL, Elasticsearch, Loki and many more. For IoT projects, we primarily use InfluxDB (time series) and Prometheus (infrastructure metrics).

Self-hosted on Hetzner. Full control, no vendor dependency, GDPR-compliant without public cloud. Grafana Cloud has advantages for very small teams without their own infrastructure – for IoT projects with sensor data in Germany, we recommend self-hosted.

For most IoT projects, Grafana OSS is sufficient. Enterprise becomes relevant for compliance requirements (audit logs), full SAML/LDAP or enterprise-only data sources. We advise on the most cost-effective edition decision.

Yes. Via organizations and teams, multi-tenant structures can be implemented: each organization has its own dashboards, data sources and alerting rules. For true tenant isolation with customer hierarchy, we recommend ThingsBoard as a complement.

Grafana Alerting (Unified Alerting since v9) is production-proven and supports multi-channel notifications (email, Slack, PagerDuty, Teams), escalation logic and silence rules. For critical alarms, we additionally recommend Alertmanager as a routing layer.

Yes. We export dashboards, data source configurations and alerting rules, deploy Grafana on Hetzner and configure the new instance. Including monitoring setup and managed operations option.

Industry-leading companies rely on us

  • Rekorder
  • Keymate
  • Führerscheinmacher
  • SolidProof
  • ARGE
  • Boese VA
  • NextGym
  • Maho Management
  • Golem.de
  • Millenium
  • Paritel
  • Yonju
  • EVADXB
  • Mr. Clipart
  • Aphy
  • Negosh

What do our customers say?

Let's Talk About Your Idea

Whether a specific IT challenge or just an idea – we look forward to the exchange. In a brief conversation, we'll evaluate together if and how your project fits with WZ-IT.

E-Mail
[email protected]

Trusted by leading companies

  • Rekorder
  • Keymate
  • Führerscheinmacher
  • SolidProof
  • ARGE
  • Boese VA
  • NextGym
  • Maho Management
  • Golem.de
  • Millenium
  • Paritel
  • Yonju
  • EVADXB
  • Mr. Clipart
  • Aphy
  • Negosh
  • ABCO Water
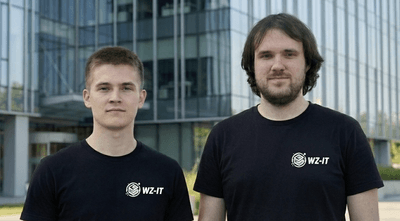
Timo Wevelsiep - Lead IoT Solutions Architect

Timo Wevelsiep

Lead IoT Solutions Architect

1/3 – Topic Selection33%

What is your inquiry about?

Select one or more areas where we can support you.